 |
 |
|
|
|
Other resources:
Click to download our 2015 review and its 2025 follow-up review on the EBNA3 proteins, or our EBNA3 review in memory of Martin Allday.
You will be able to find urls for EBV ChIP-seq data here. These links no longer work as intended on the UCSC genome viewer (which we have been unable to resolve), but do work in our hands for local viewing (e.g. on IGV).
You will be able to browse our EBV microarray data here.
Download Paul Farrell's EBV genome annotation map (also available as an Excel file). An historic version from 1992 (In: Genetic Maps (1993) p1.120) includes citations for the original identification of most EBV transcripts.
Annotations of the EBV BAC and the prototype EBV sequence NC_007605, informed by direct RNA-seq of LCLs as published in Mamane-Logsdon et al (2025), include gff3 files and associated FASTA files. Also from this paper, you can download the raw reads, the processed and analysed data, and the scripts and their associated annotation files which are explained in this page of Rob White's github repository.
Download of a multiple sequence alignment fasta file of EBV genomes based on that used in Bridges et al 2019. Note that some sequence in repeats is included but poorly aligned (others are masked with Ns).
To find out how EBV regulates your gene of interest:
1. Published data is available without a login. For access to unpublished or restricted data you will need to login.
2. Enter Gene name/ENSEMBL Gene ID or CD ID (use % as a wildcard term)
If gene name is not found, please look up HGNC ID or Ensembl ID - a link is provided.
Note that this links to the version of ENSEMBL used to generate the data.
3. Select experimental dataset
This will bring up a table of genes that fulfil the search terms, and a table of transcripts for the selected gene. Clicking on the ENSEMBL IDs in the table will take you to the ENSMBL website for that gene/trancript.
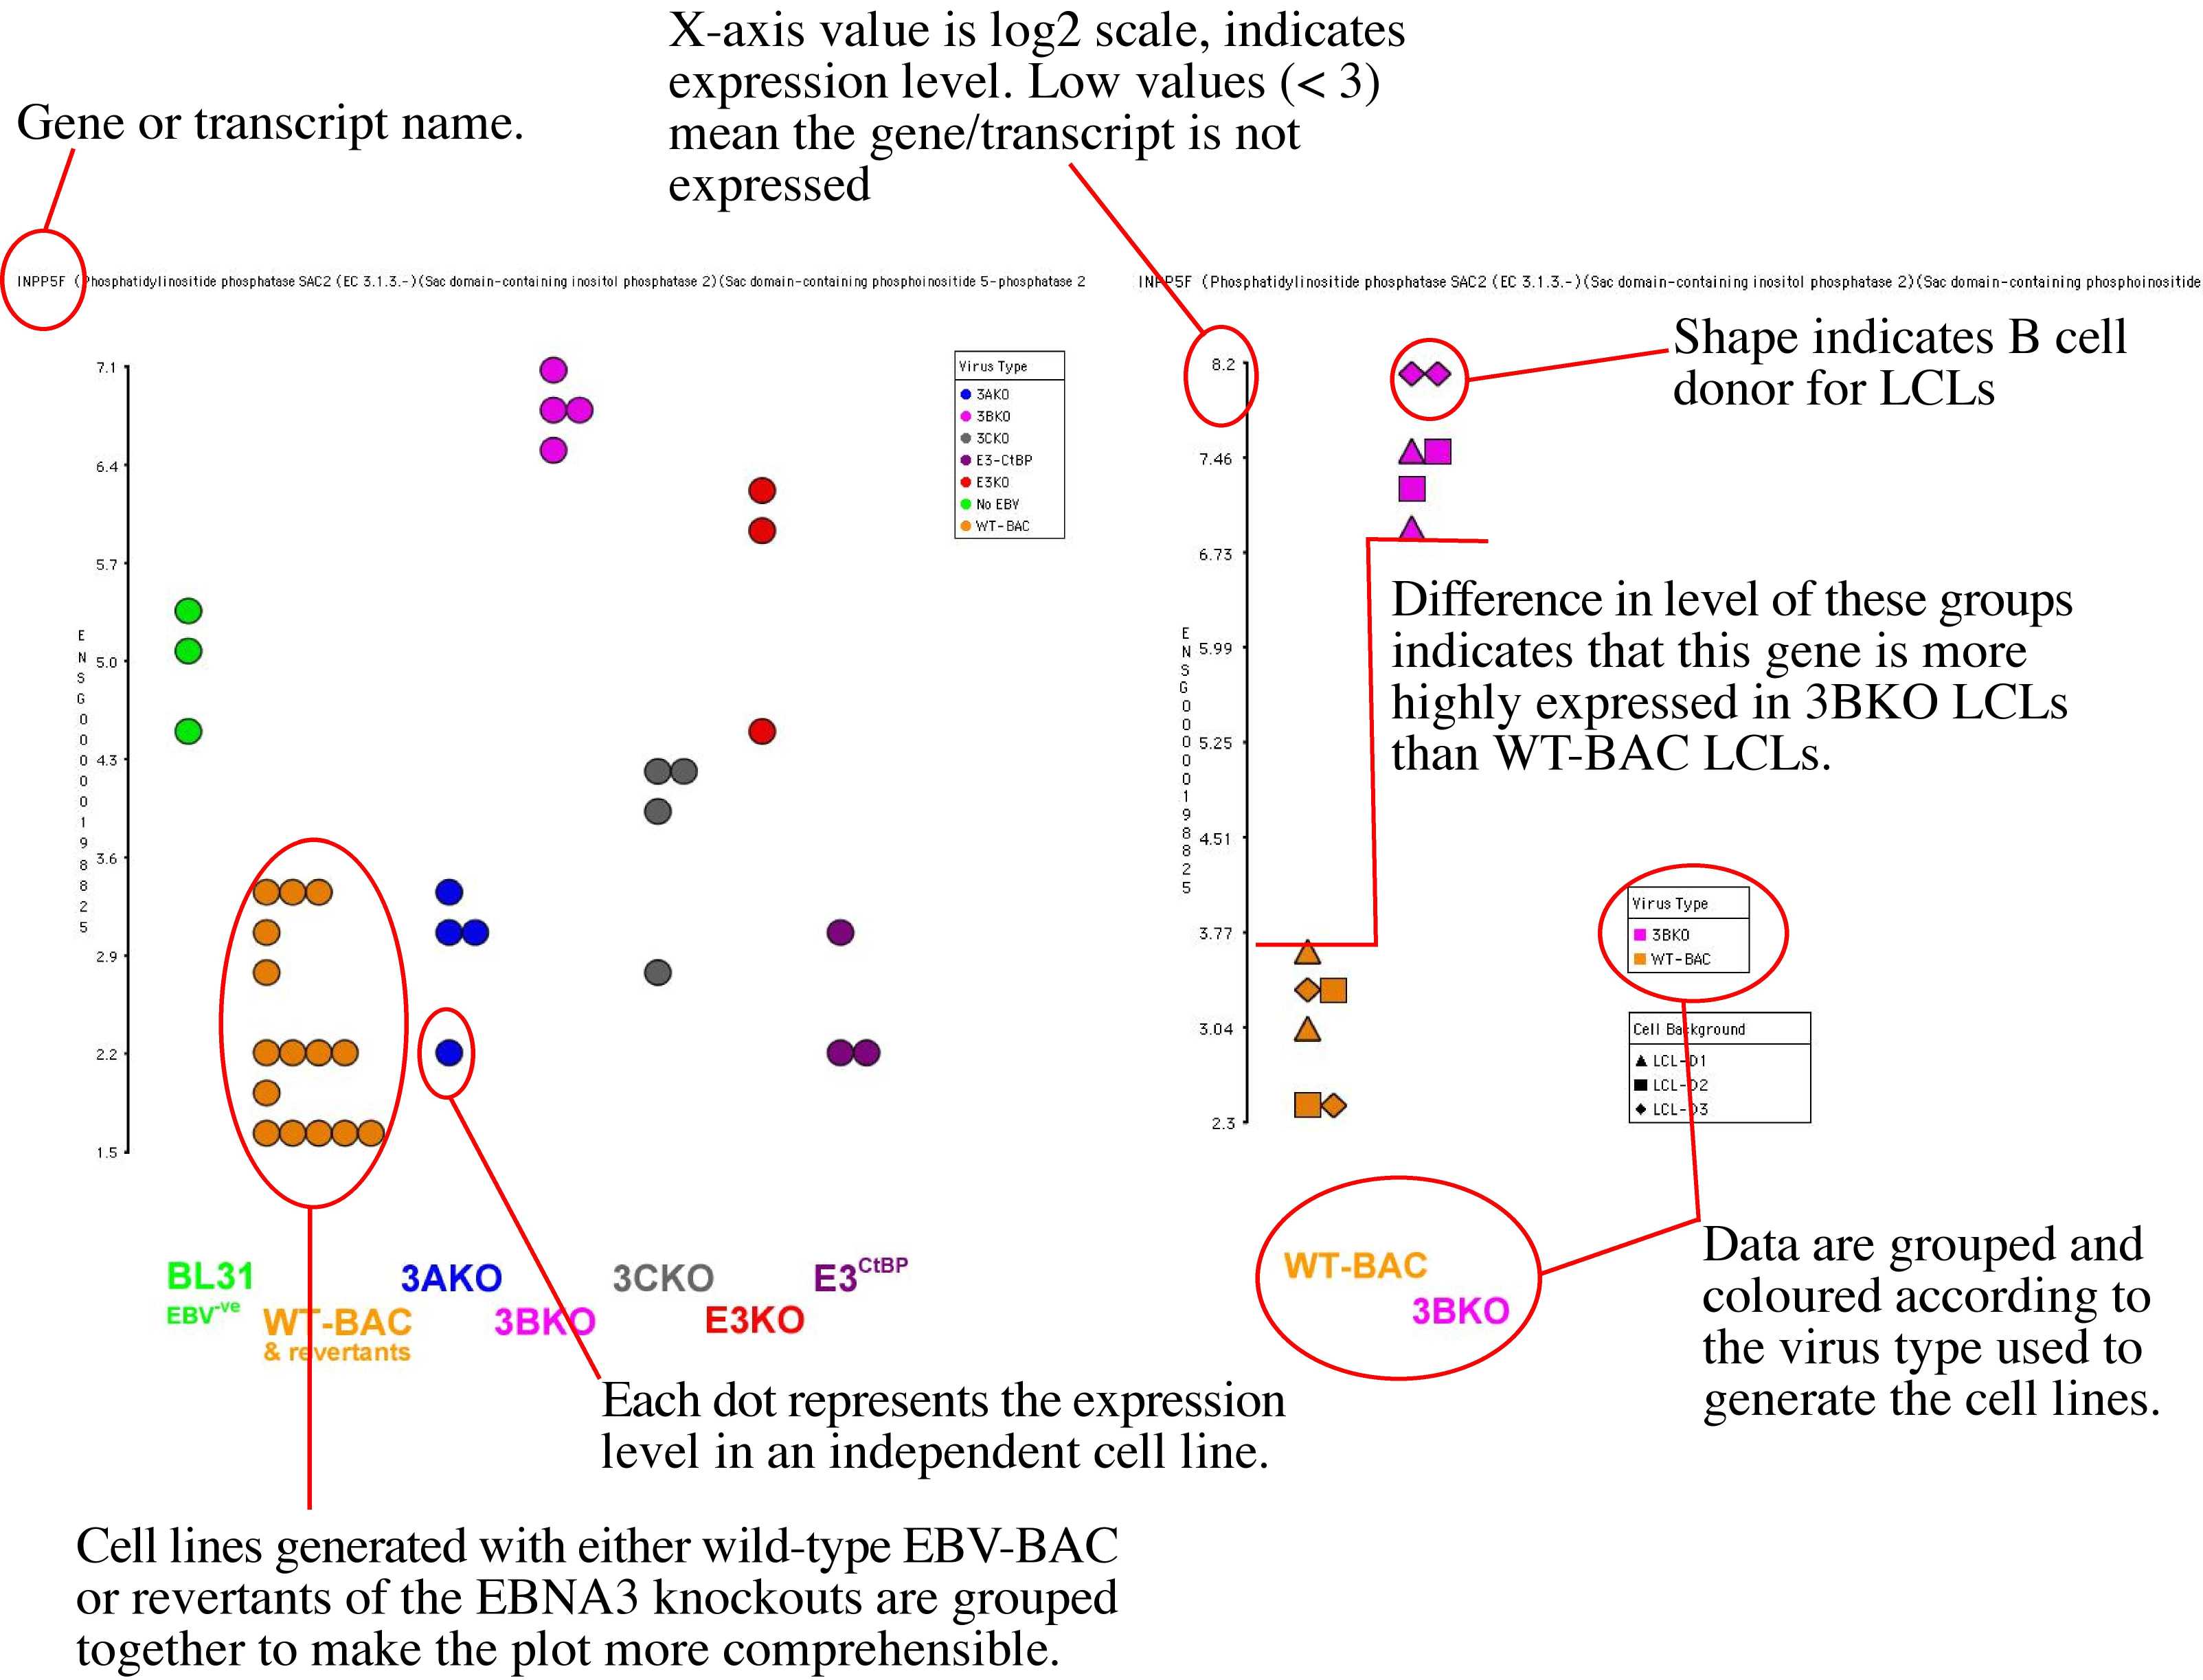
The gene level data is diplayed in the form of a dotplot. Important facets of the plot are indicated in the pair of examples below.
Dotplots for individual genes and transcripts can be selected with the buttons in the table.
For more detail on the motivation behind this website, an overview of the experimental approach and the detail of the observations, click here.
